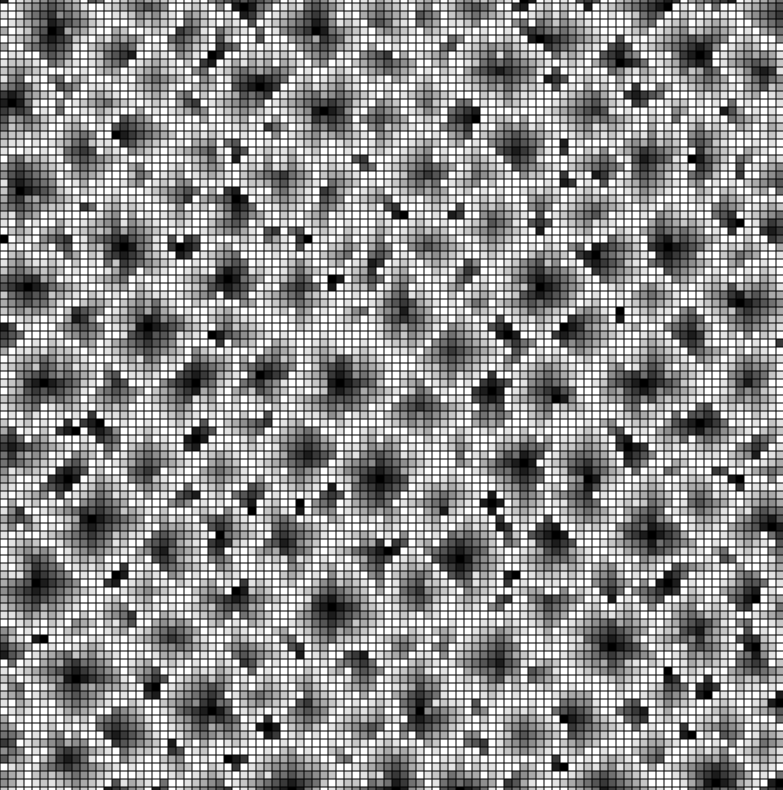
Part of my solution for Advent of Code 21 Day 9 – a Jupyter / Python notebook to create a graphic from the height data that was provided. The solution required this map and I thought a graphic of it might be fun to create.
Part of my solution for Advent of Code 21 Day 9 – a Jupyter / Python notebook to create a graphic from the height data that was provided. The solution required this map and I thought a graphic of it might be fun to create.