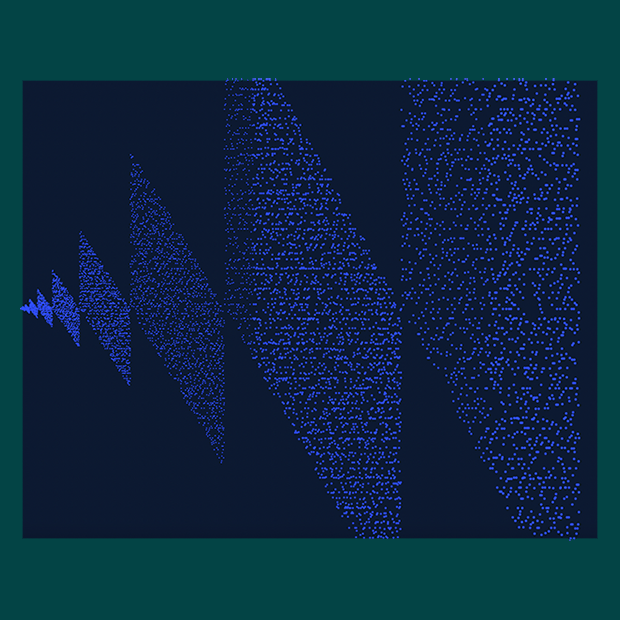
Plot of OEIS A265326 in Python / p5
“And what does the graph look like? It’s amazing. It’s a series of parallelograms – aligned along the x-axis.”
I created a plot of OEIS A265326 after watching Neil Sloane on Numberphile. The series is composed of the primes written in base 2, then reversed and subtracted from one another.
The notebook can be seen here. To see the output run all of the cells by selecting Cellule > Exécuter Tout
The plot was made using Processing / P5 in a Python Notebook. The notebook runs in the browser using Basthon – see these instructions.
